

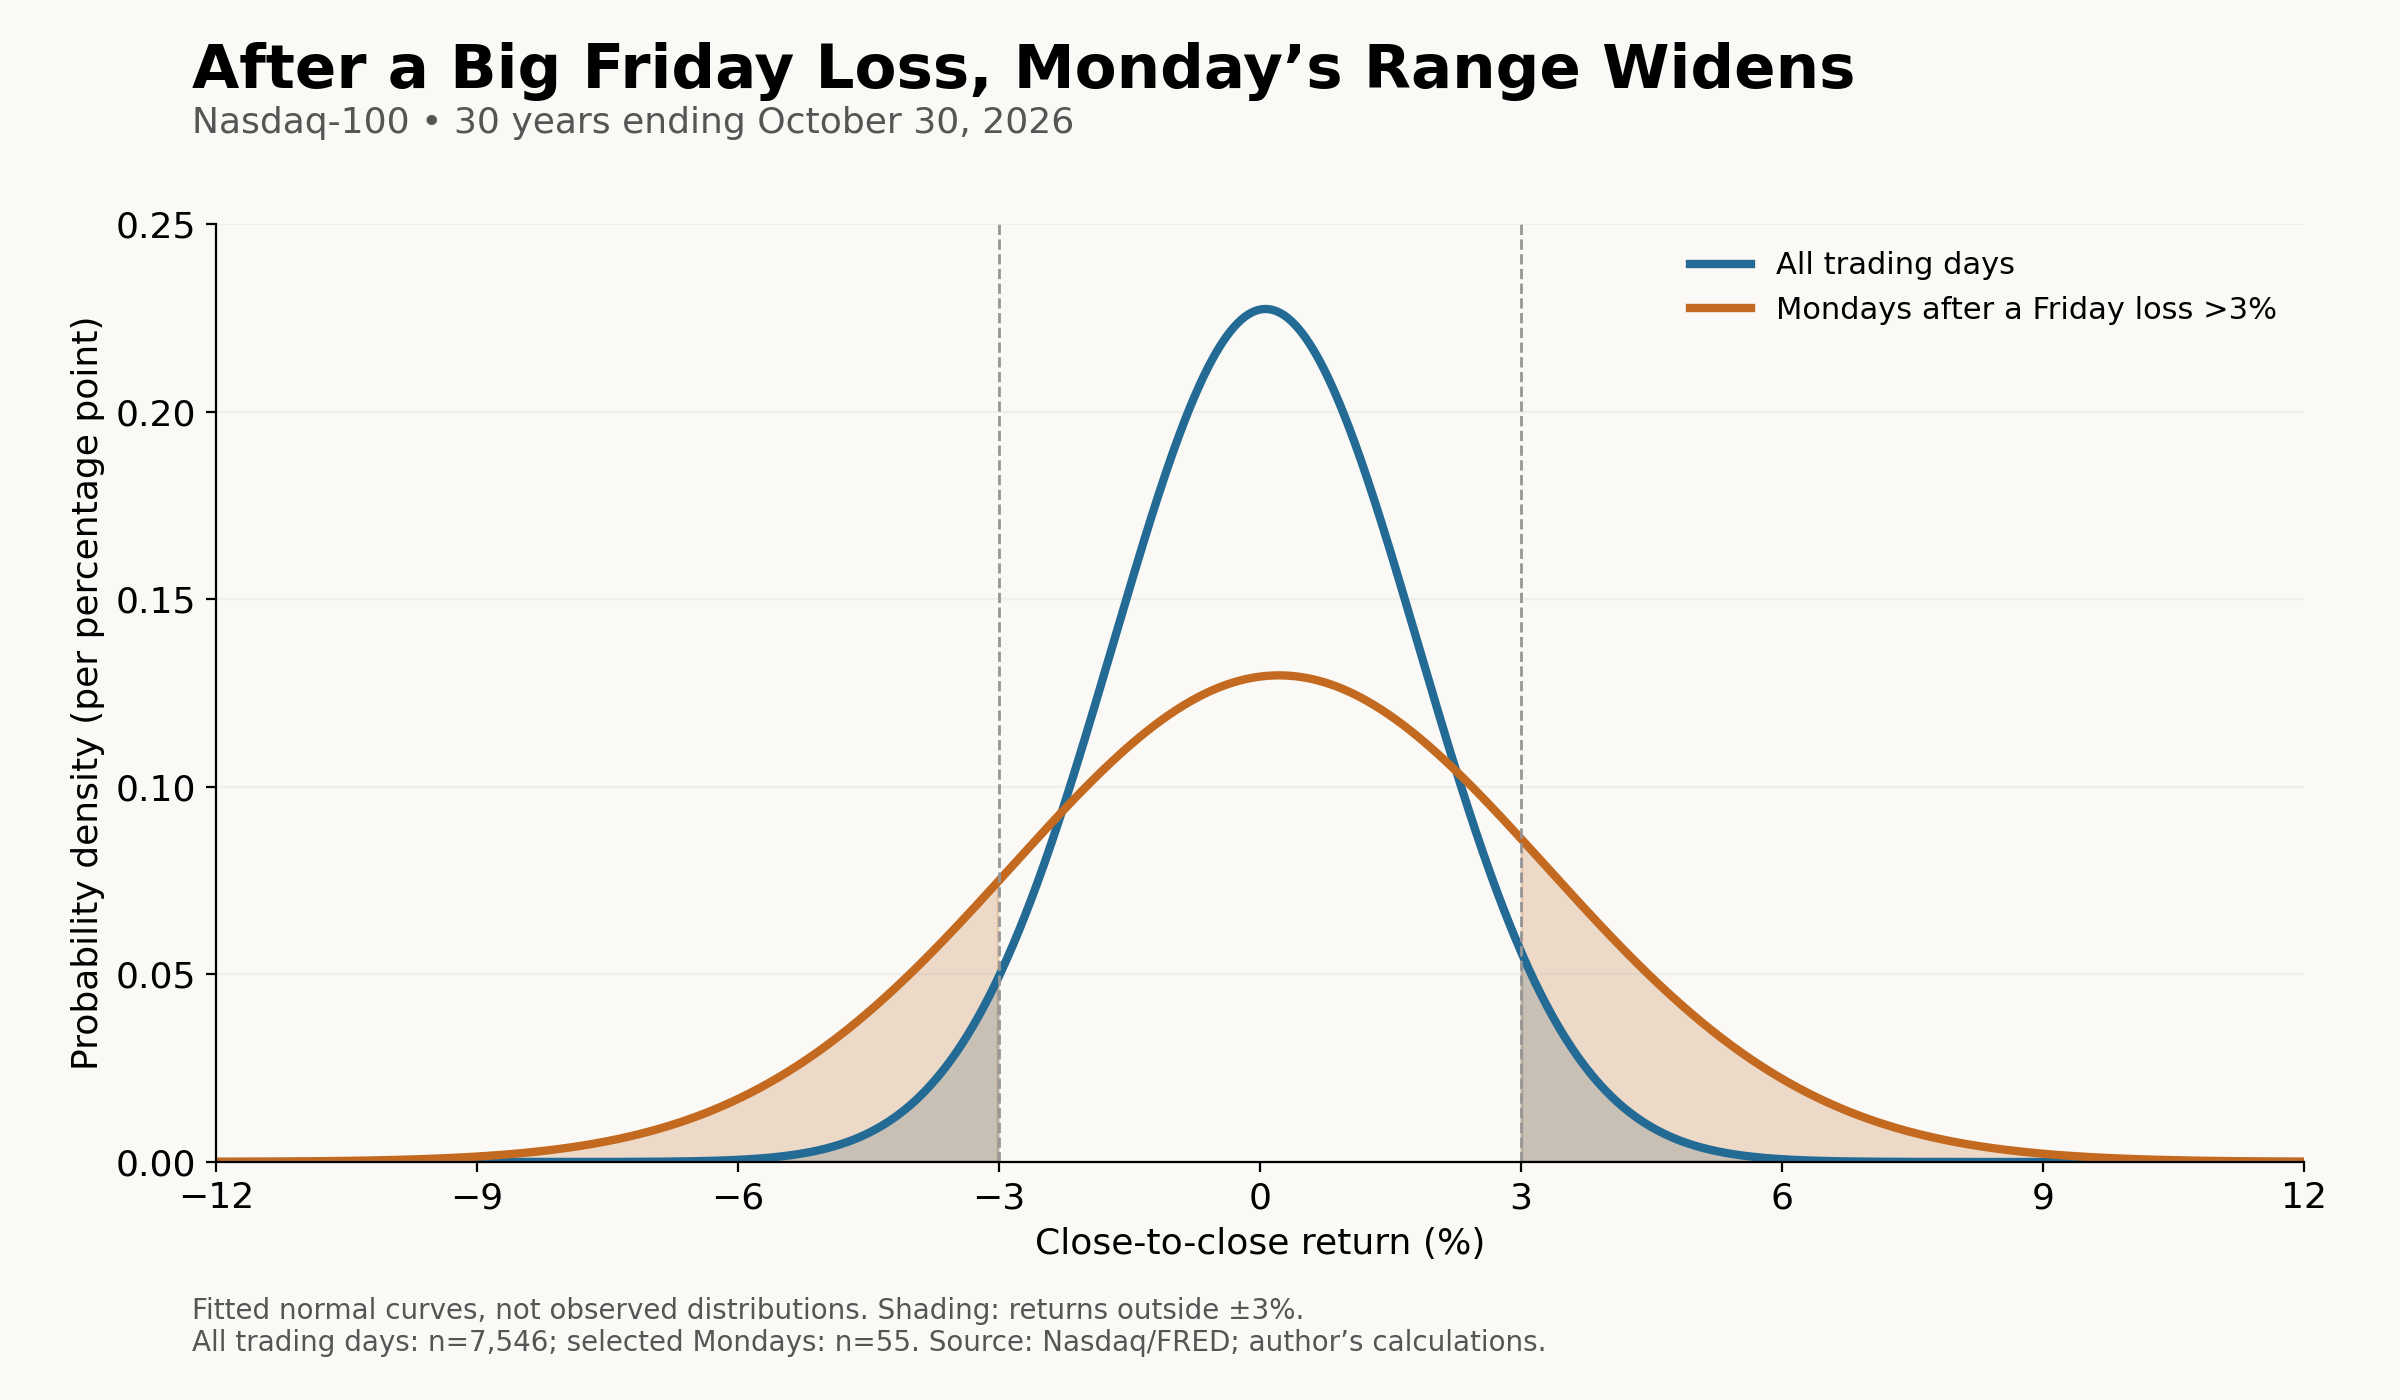
Thirty years of market history suggest a wider range of Monday outcomes—plus an approaching election.
Thank you for reading Economic Memos. To explore my paid coverage, try a 14-day free trial or subscribe at 50 percent off, for an annual fee of $25. Your support helps sustain this independent work.
The Nasdaq-100 fell 3.46% on Friday, October 30, 2026, losing 1,017.66 points. What does a selloff of this magnitude reveal about subsequent price movements? This is an especially pressing question given political turmoil around the upcoming election and potential ramifications from California’s wealth tax referendum.
Key Takeaway: A Friday decline exceeding 3% in the Nasdaq-100 leads to significantly wider up and down tails in price movement on the subsequent Monday.
I examined Nasdaq-100 daily closing values over the 30 years ending October 30, 2026. The index experienced 63 Friday declines greater than 3%, including the latest one. Of the 62 previous occurrences, 55 were followed by an open trading Monday (seven preceded Monday holidays and are excluded from the Monday calculations). All metrics use Nasdaq closing values distributed through FRED.
What the History Shows
The primary finding is a marked increase in the frequency of large moves in both directions after a substantial Friday selloff:
Moves exceeding 3% in either direction: Occurred on 8.3% of all trading days, 7.5% of all Mondays, and 23.6% of Mondays following Friday declines exceeding 3%.
Moves exceeding 5% in either direction: Occurred on 1.8% of all trading days, compared with 7.3% of the selected Mondays—about four times as frequently.
Both tails matter: Of the 55 selected Mondays, five lost more than 3% and eight gained more than 3%. Returns ranged from −9.86% to +10.02%.
Only a modest rebound tendency: The index rose on 31 Mondays and fell on 24. The average return was +0.22%, and the median was +0.19%.
What This Means for the Coming Week
History points to greater volatility in both directions, not a reliable forecast. My own judgment is more pessimistic: given what appears to be unfolding in the world, the approaching election, and California’s wealth-tax referendum, I expect a bad day for technology investors on Monday. That is my assessment of current events, not a conclusion established by these historical comparisons.
Data Appendix: Historical Friday Selloffs and Monday Returns
Identifies all 63 Nasdaq-100 Friday declines exceeding 3% during the 30 years ending October 30, 2026. Seven following Mondays were market holidays (Tuesday returns shown for reference but excluded from Monday statistics). Returns use unrounded closing values; combined returns are compounded.
Thank you for reading Economic Memos. To explore my paid coverage, try a 14-day free trial or subscribe at 50 percent off, for an annual fee of $25. Your support helps sustain this independent work.
Data on 62 previous Friday declines follows:
1. January 9, 1998: Friday −3.86%; Monday, January 12, +1.57%.
2. July 31, 1998: Friday −3.15%; Monday, August 3, −0.64%.
3. August 28, 1998: Friday −3.60%; Monday, August 31, −9.86%.
4. February 12, 1999: Friday −4.21%; Monday closed; Tuesday, February 16, −0.21%.
