

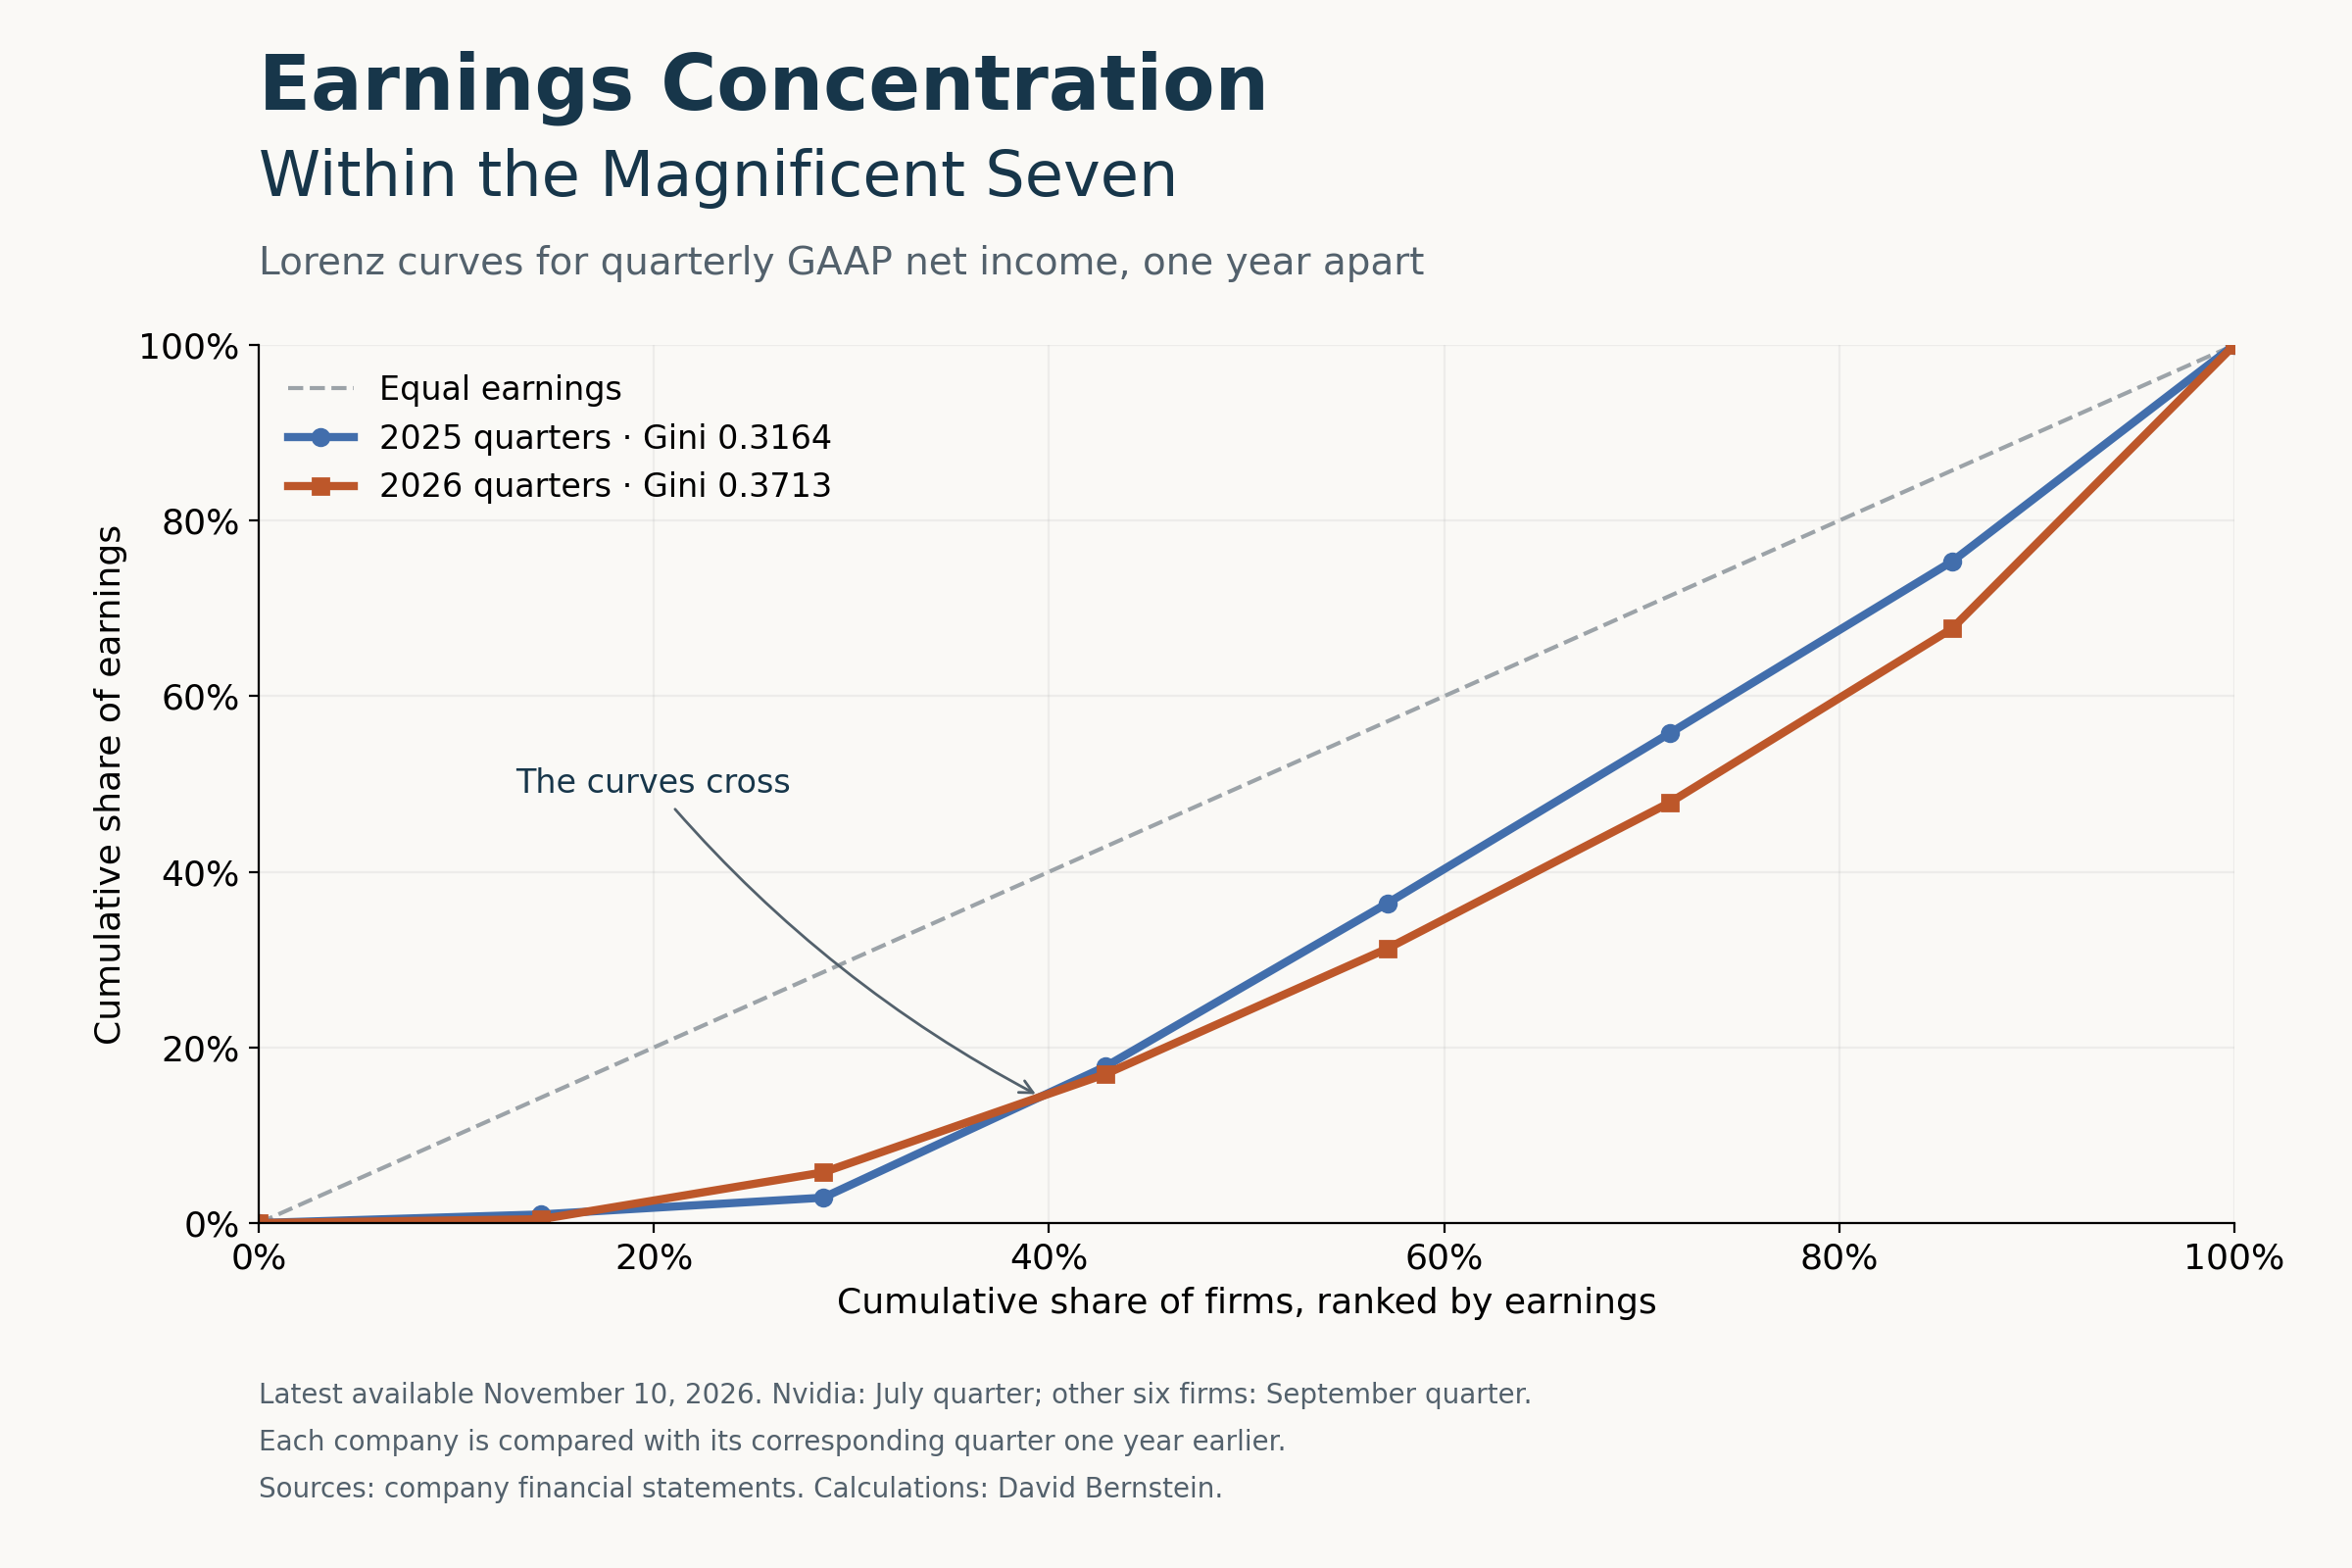
Discussions of stock-market concentration frequently emphasize how much a few large companies contribute to market capitalization or earnings growth. This article examines the distribution of earnings within the Magnificent Seven, using Lorenz curves and Gini coefficients to assess whether profits have become more concentrated among these seven corporate giants.
Lorenz curves and Gini coefficients are commonly used to measure income inequality across households. Here, we apply them to corporate earnings. The Lorenz curve shows the cumulative share of profits earned by firms ranked from lowest to highest earnings. The Gini coefficient summarizes how unequally those profits are distributed, with higher values indicating greater inequality. These measures describe the full distribution of earnings shares rather than focusing exclusively on the share earned by one or two leading companies.
This analysis examines concentration at the very high end of the corporate population: Apple, Microsoft, Alphabet, Amazon, Nvidia, Meta and Tesla. It asks whether profits are relatively evenly distributed among these giants or concentrated in a few members. It does not measure their dominance over smaller companies or the rest of their industries.
Profits could be evenly distributed among these seven firms while the group collectively dwarfs the rest of the market. Conversely, increasing inequality within the group would indicate that its combined earnings depend more heavily on a few members. These are separate dimensions of corporate concentration.
A comparison of the latest available quarterly results with the corresponding quarters one year earlier shows greater earnings inequality within the Magnificent Seven. The Gini coefficient increased from 0.3164 to 0.3713, while Nvidia displaced Alphabet as the largest profit producer.
Data and Method
The analysis uses consolidated net income reported under generally accepted accounting principles, or GAAP. Dollar earnings provide a common basis for comparing companies; earnings per share would introduce differences arising from each company’s share count.
The data reflect results available on November 10, 2026. The comparison represents two snapshots of the latest available quarterly earnings, a year apart. Nvidia’s results cover a quarter ending in July, while the other companies’ results cover quarters ending in September. Each company is compared with its own corresponding quarter one year earlier. The Excel appendix provides the earnings data and period-end dates.
For each year, companies are ranked independently from lowest to highest earnings. The Lorenz curve plots the cumulative percentage of companies on the horizontal axis against their cumulative percentage of profits on the vertical axis. If every company earned the same amount, the curve would follow a diagonal line of equality. Greater departures below that line indicate a more unequal distribution.
The Gini coefficient equals the area between the equality line and the Lorenz curve divided by the total area beneath the equality line. Zero indicates equal earnings across firms. The calculations treat these seven companies as the full population of interest, without a sample-size correction.
All seven companies reported positive net income in both periods.
A More Concentrated Distribution
The Gini coefficient increased by approximately 0.055, from 0.3164 in the year-earlier snapshot to 0.3713 in the latest snapshot. Reported profits became more unequally distributed within the group.
Nvidia’s quarterly net income increased from $26.422 billion to $59.688 billion, raising its share of the group’s earnings from 18.6% to 32.3%. Alphabet, previously the largest profit producer, reported $26.468 billion, compared with $34.979billion one year earlier.
The combined earnings share of the two largest profit producers also increased. In the earlier snapshot, Alphabet and Microsoft accounted for 44.2% of total profits. In the latest snapshot, Nvidia and Microsoft accounted for 52.1%.
The change was not uniform throughout the distribution. The two lowest-earning firms, Tesla and Meta, increased their combined share from 2.9% to 5.8%, largely reflecting Meta’s higher reported earnings.
The Lorenz curves in the image at the top of this post cross, showing that the change in earnings concentration was not uniform across the seven firms. The orange 2026 curve lies above the blue 2025 curve at the second-ranked firm, indicating a larger cumulative earnings share for the bottom two. Farther along, it falls below the blue curve, reflecting the greater share earned by the largest profit producers. The higher Gini indicates greater inequality according to that summary measure, but the latest distribution is not more unequal at every point along the curve.
What These Results Establish
The Magnificent Seven comprise companies with substantial differences in reported earnings. Their collective prominence should not obscure those differences. In the latest snapshot, two firms produced more than half of the group’s profits, and Nvidia alone produced nearly one-third.
This measures the distribution of dollar profits, rather than profitability relative to company size. Earnings can differ because companies have different revenues, assets, business models and profit margins. A company earning fewer dollars is not necessarily less profitable relative to its resources or less successful in serving its market.
Reported accounting earnings also include investment gains and losses, taxes and legal charges. Alphabet’s other income and expense swung from a substantial positive contribution to a negative one. Amazon’s year-earlier earnings included significant investment gains, while Meta’s comparison was affected by taxes and legal expenses. Such items can change both company rankings and measured concentration.
The results therefore describe the distribution of GAAP profits rather than recurring operating earnings. Two quarterly snapshots cannot establish a persistent trend, and a higher Gini does not by itself demonstrate greater monopoly power or predict investment returns.
Finally, measuring the seven firms’ collective share of broader-market profits requires their combined earnings and total index earnings. Constructing a Lorenz curve for the entire S&P 500 or Nasdaq-100 requires earnings for every constituent.
The finding here is narrower: reported profits became more concentrated within the Magnificent Seven themselves, with Nvidia emerging as the largest contributor. Understanding concentration among these giants complements an examination of their dominance over the broader corporate population.
An accompanying Excel appendix, available to paid subscribers, provides the ranked earnings data for both periods, Lorenz-curve coordinates, Gini coefficient calculations, accounting notes and links to the original financial statements.
