

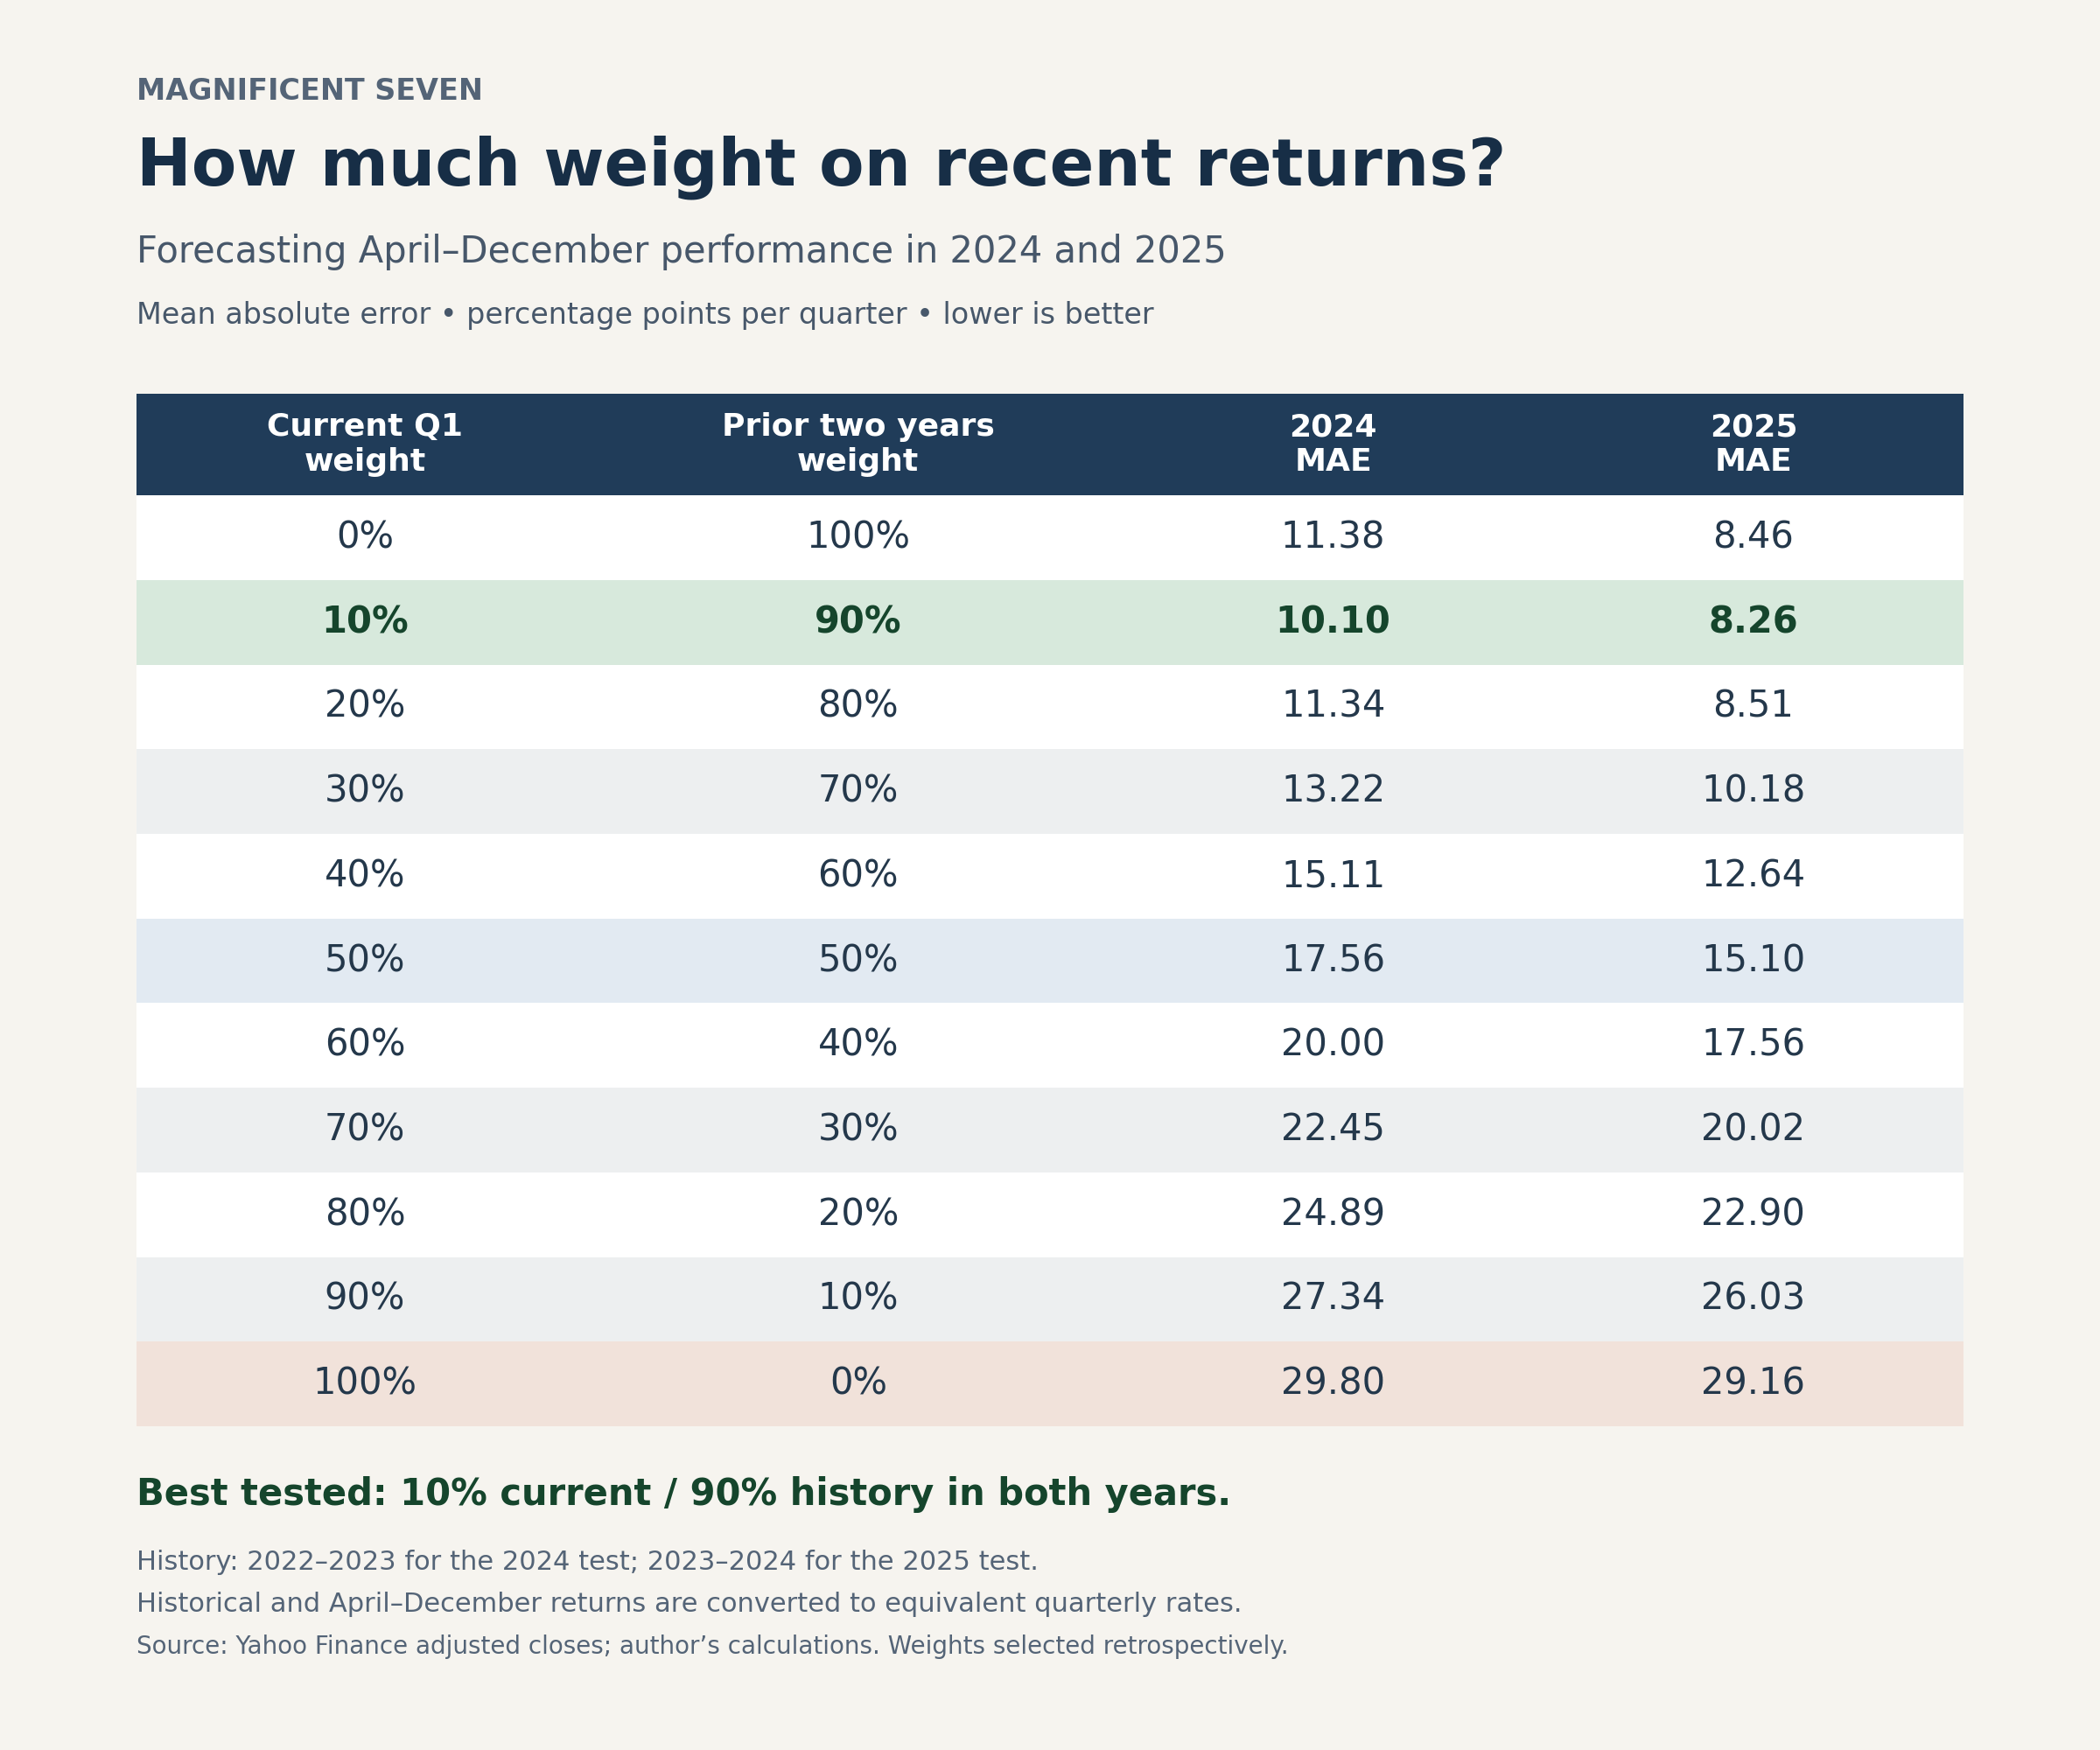
For each Magnificent Seven stock, I compare forecasts based on its first-quarter return, its prior two years’ equivalent quarterly return, and weighted averages of the two. The experiments predict April–December performance in 2024 and 2025.
· A 50/50 average improved forecasts for six stocks in 2024 and all seven in 2025 compared with using first-quarter returns alone.
· Giving 10% weight to the first quarter and 90% to history produced the lowest mean absolute error (MAE) in both years among the weights tested.
· History alone substantially outperformed the 50/50 average, coming close to the best combination.
· Using only the current year’s first-quarter return produced the largest MAE in both years.
Prologue
Yesterday’s article, “From Baseball Batting Averages to Magnificent Seven Returns,” drew inspiration from Bradley Efron and Carl Morris’s influential 1975 Journal of the American Statistical Association article, “Data Analysis Using Stein’s Estimator and its Generalizations.” Their application to baseball batting averages illustrated how moderating early performance estimates could improve predictions of subsequent performance.
I asked a related question about Apple, Microsoft, Amazon, Alphabet, Meta, Nvidia, and Tesla: could combining recent stock returns with a longer history improve forecasts?
For each company, I compared two predictions of its April–December 2025 performance. The first simply extrapolated its first-quarter return. The second averaged that return with the equivalent quarterly return over 2023–2024, giving each observation a 50% weight.
The blend produced a smaller absolute error for every stock. Across the seven companies, mean absolute error fell from 29.16 to 15.10 percentage points per quarter, an improvement of approximately 48.2%.
My exercise differs from Efron and Morris’s approach. Their estimator borrowed information across players. My forecasts use only each company’s own history. The statistical insight inspired the experiment, but these calculations are not an application of their estimator.
Introduction
Today’s memo addresses two questions.
First, does the original result hold for the same firms in the preceding year? Repeating the experiment for 2024 allows us to examine whether the advantage of blending appears in two consecutive years.
Second, and more importantly, should recent performance and the longer history receive equal weight? The original comparison established that 50/50 beat extrapolating the first quarter in 2025. It did not establish that equal weighting was best—or even that it improved on using history alone.
For the 2024 experiment, I use first-quarter 2024 returns and the two-year history covering 2022–2023 to predict April–December 2024 performance. The 2025 experiment retains its original historical window, 2023–2024.
In both experiments, the two-year historical return is converted into an equivalent quarterly growth rate. The April–December outcome is also converted into an equivalent quarterly rate, keeping the forecasts and outcomes on the same time scale.
I then test eleven combinations, increasing the weight on the first quarter from zero to 100% in ten-percentage-point increments. The remaining weight goes to the historical quarterly return. Thus, 10/90 means 10% on the current year’s first quarter and 90% on the prior two years’ equivalent quarterly return.
Each combination uses the same weight for all seven companies. I rank the combinations by mean absolute forecast error across the seven firms, giving each company equal importance. The calculations use Yahoo Finance adjusted closing prices to account for splits and dividend distributions.
Results
The table image at the beginning of this article summarizes the forecast errors for all eleven weighting combinations in both years.
The 50/50 estimator beat the first quarter only estimator in both years, reducing MAE by 41.1% in 2024 and 48.2% in 2025. It improved forecasts for six of seven stocks in 2024—Alphabet was the exception—and all seven in 2025.
But the estimator that was 50 percent current year and 50 percent history was not the best one.
The estimator that was 10% current and 90% history produced the lowest MAE among the eleven combinations tested in both years:10.10 percentage points in 2024 and 8.26 in 2025.
This was over 40 percent smaller than the 50/50 estimator in both years.
Three additional results stand out. History alone substantially outperformed 50/50 in both years. Adding 10% current weight improved on history alone, reducing its error by 11.2% in 2024 and just 2.4% in 2025. Using first quarter returns alone produced the largest MAE in both years.
Conclusions
The first extension repeated the original 50/50 comparison for 2024. Combining first-quarter returns with the preceding two years’ history improved forecasts for six of seven companies, compared with all seven in 2025.
The second extension tested different weights on recent performance and history. In both years, history alone substantially outperformed equal weighting, while 10% on the first quarter and 90% on history produced the lowest mean absolute error among the combinations tested.
We tested weights at intervals of 0.1. The actual optimal weight could differ, and the best combination was selected after observing the outcomes.
This experiment examined seven large, established technology companies that dominate today’s market. All survived, and none experienced a major permanent collapse during the evaluation periods. I expect very different results when this experiment is applied to smaller companies, some of which may not survive.
The Excel appendix below the paywall contains the source prices, historical and evaluation returns, forecasting formulas, individual errors, and complete weight search for both years, allowing readers to examine and reproduce the calculations. The annual subscription fee is $30 with coupon on checkout. There is also a 14-day trial. Any problems contact me.
