

Jason Zweig’s Wall Street Journal article, “How a Few Hot Stocks Can Make ‘Twin’ Funds Act Like Strangers,” shows that large-growth funds that appear similar can produce very different results because index providers classify, weight, and rebalance stocks differently. Zweig specifically compares several large growth funds. This paper extends Zweig’s analysis by considering the ramifications of adding different growth funds and combinations of growth funds to a portfolio where the core fund is iShares Russell 1000 ETF (IWB), a broad U.S. large- and mid-cap index fund tracking roughly 1,000 of the largest U.S. companies.
The six portfolios compared are 100% IWB, 80% IWB / 20% IWF, 80% IWB / 20% VUG, 80% IWB / 20% RPG, 80% IWB / 10% IWF / 10% VUG, and 80% IWB / 6.67% IWF / 6.67% VUG / 6.67% RPG.
Using recent 2026 holdings data, the three growth funds considered for the portfolio sleeve—IWF, VUG, and RPG—differ in the following ways.
· IWF — iShares Russell 1000 Growth ETF. The fund holds about 367 stocks. Its four largest positions are NVIDIA, Apple, Alphabet Class A, and Broadcom, which together account for about 34.7% of the fund. Information technology represents about 54% of the portfolio.
· VUG — Vanguard Growth ETF. The fund holds about 154 stocks. Its four largest positions are NVIDIA, Apple, Microsoft, and Alphabet Class A, which together account for about 40.4% of the fund. Technology represents about 70% of the portfolio. Thus, VUG is considerably more concentrated in both its largest companies and technology than IWF.
· RPG — Invesco S&P 500 Pure Growth ETF. The fund holds only about 69 stocks, but its holdings look very different from those of IWF and VUG. Its four largest positions are Sandisk, Micron Technology, Comfort Systems USA, and CrowdStrike, which together account for only about 15.0% of the fund. Technology represents about 41% of the portfolio. RPG therefore has far fewer holdings but is much less dominated by the mega-cap growth companies that lead IWF and VUG because its index weights stocks according to growth characteristics rather than simply allowing the largest growth companies to dominate the portfolio.
The experiment asks which of these six core/sleeve combinations performed best. The results also provide limited evidence on whether an investor benefits from holding more than one growth fund in the sleeve.
Analysis:
The sample runs from April 2006 through December 2025, the longest common live-history period available for all four ETFs. The analysis contains 237 monthly return observations.
Monthly total returns are calculated from month-end adjusted prices, incorporating distributions. Each portfolio begins with its stated allocation in April 2006. There is no subsequent rebalancing.
The risk-free rate used in the Sharpe-ratio calculations is based on monthly TB3MS Treasury-bill observations from the Federal Reserve Bank of St. Louis.
The Sharpe ratio measures return relative to risk:
Annualized Sharpe Ratio = [(Average Monthly Portfolio Return − Average Monthly Risk-Free Return) ÷ Monthly Portfolio Volatility] × √12
A higher Sharpe ratio indicates that an investor received more return for each unit of risk taken, which makes it useful for comparing portfolios whose returns and volatility differ.
The principal measures emphasized here are compound annual growth rate and the Sharpe ratio. CAGR measures the annualized rate at which wealth compounded over the period. The Sharpe ratio evaluates return relative to the volatility incurred in earning that return.
The no-rebalancing assumption also provides an intuitive test. Holdings that outperform are allowed to become larger portions of the portfolio rather than being periodically reduced back to their starting weights.
Results
The six portfolios can be summarized using two principal measures:
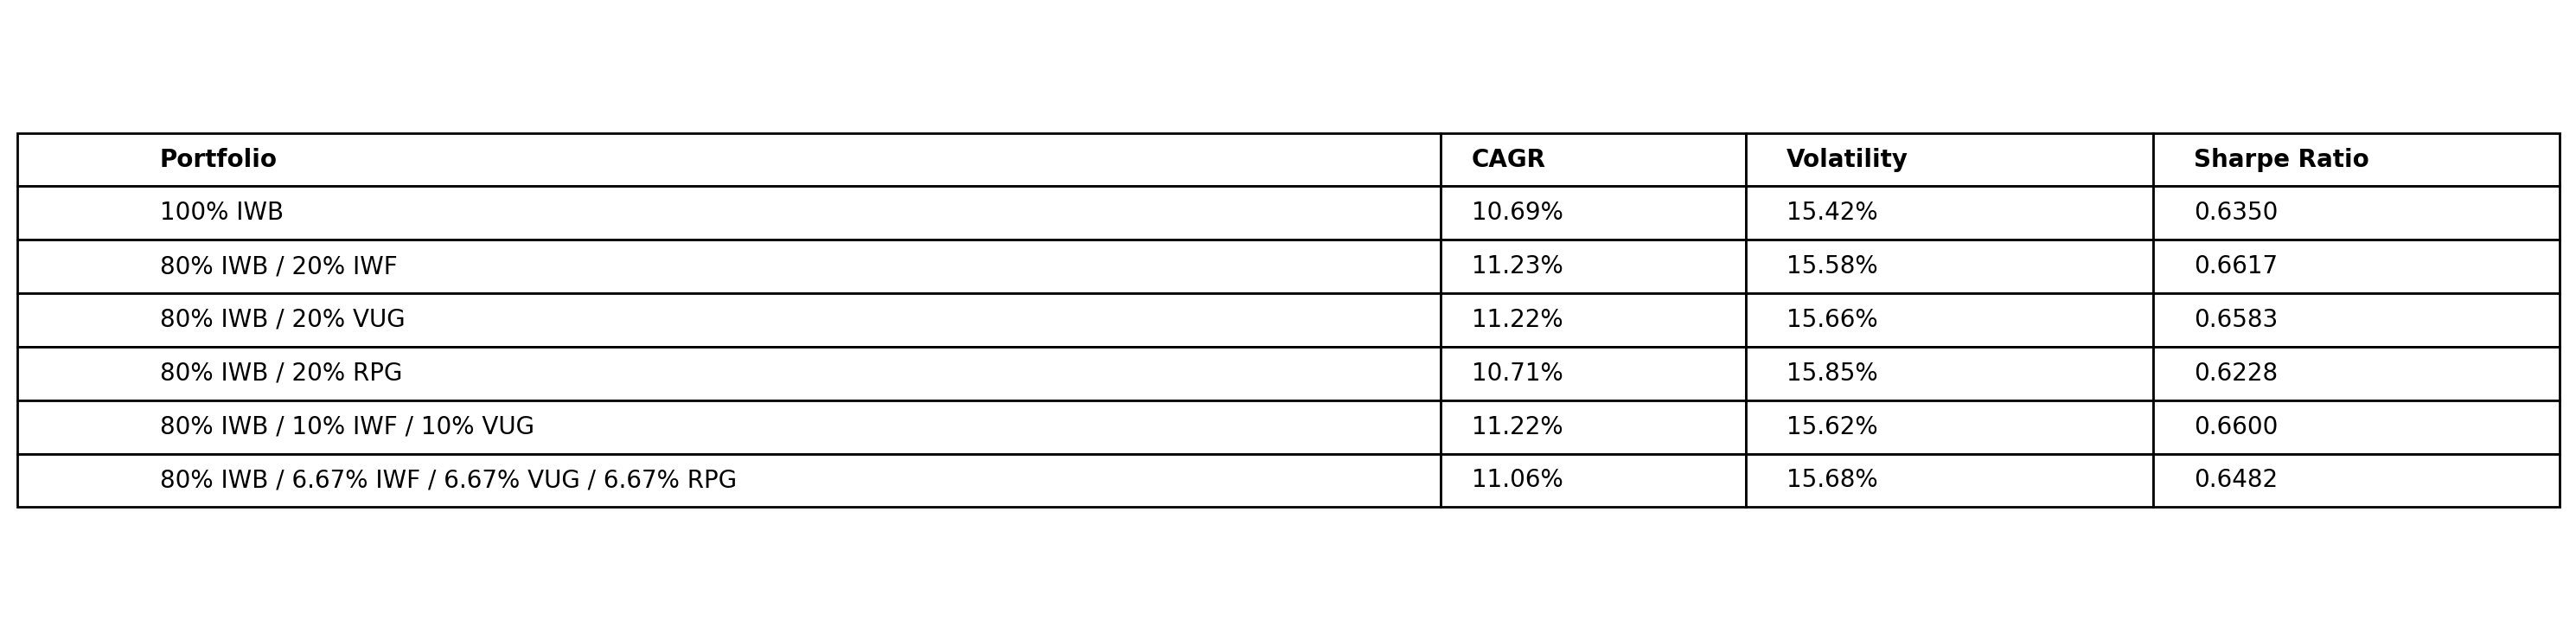
Return. IWB alone produced a 10.69 percent CAGR. The highest return came from 80 percent IWB/20 percent IWF at 11.23 percent, followed almost indistinguishably by 80 percent IWB/20 percent VUG and 80 percent IWB/10 percent IWF/10 percent VUG, both at 11.22 percent. Adding RPG to IWF and VUG lowered the three-fund combination to 11.06 percent. The RPG-only growth tilt produced 10.71 percent, barely above IWB.
Return adjusted for risk. The Sharpe ratio tells essentially the same story. The 20 percent IWF portfolio ranked first at 0.6617, followed by the IWF/VUG combination at 0.6600 and VUG at 0.6583. The three-growth-fund combination fell to 0.6482. IWB was 0.6350, while the RPG portfolio ranked last at 0.6228. Thus, RPG not only produced substantially less additional return than IWF or VUG; after adjusting return for volatility, it performed worse than IWB itself.
Although an annual-return difference of roughly one-half percentage point may appear modest, compounding makes it meaningful over nearly twenty years. An initial $100,000 invested in IWB grew to approximately $743,000, while the 80 percent IWB/20 percent IWF portfolio grew to approximately $818,000—a difference of about $75,000.
Adding either IWF or VUG increased both return and risk-adjusted return. One reason the difference relative to IWB was not larger is that IWB itself already contained substantial exposure to many of the same large technology and growth companies. Although the initial 20 percent IWF allocation grew to about 27 percent without rebalancing, the resulting increase in the portfolio’s underlying technology exposure was therefore more modest than the change in the fund weights alone might suggest.
Adding RPG to the growth sleeve reduced both return and risk-adjusted return relative to using IWF or VUG. This does not establish that investors should always diversify across growth funds, but it does show the risk of relying on a single fund simply because it carries the desired style label. An investor who does not understand the differences among competing index methodologies may therefore have reason to diversify across broadly similar approaches rather than assume in advance that one particular methodology will prove superior.
The broader lesson is that investors either need to understand in considerable detail what their funds own and how their indexes are constructed, or they need to diversify across methodologies rather than assume that funds with the same label are interchangeable. Two overlapping funds may still reduce index-selection risk, while another fund in the same category may represent a substantially different investment strategy.
Appendix: Verification of Portfolio Calculations
Sample period: April 2006–December 2025
The portfolio results reported in this paper were independently reconstructed in Python and in an Excel-compatible spreadsheet workbook. The purpose of this appendix is to document that verification rather than repeat the substantive findings discussed in the paper.
The analysis uses 237 monthly observations based on month-end adjusted prices for IWB, IWF, VUG, and RPG, incorporating distributions. Each portfolio was established at its stated initial allocation in April 2006 and was not subsequently rebalanced. The risk-free rate used in calculating Sharpe ratios is based on the monthly TB3MS Treasury-bill series.
For verification, the monthly portfolio paths were rebuilt independently from the underlying fund data. CAGR, volatility, Sharpe ratios, and the other portfolio statistics were then calculated separately in Python and with spreadsheet formulas. The two implementations agreed essentially to machine precision, with a largest absolute difference across the principal statistics of approximately 1.6 × 10⁻¹⁵.
Figure A1. Independently verified portfolio results, April 2006–December 2025.
The verification therefore confirms that the return and risk comparisons reported in the paper are reproducible under the stated no-rebalancing methodology.
Author’s Note: Readers interested in related work on portfolio construction may also want to see Can Investors Find the Few Stocks That Create Most Market Wealth?, which examines the evidence for diversification when a small number of stocks generate most market wealth, and Broad Market vs. Sector ETFs: Risk & Return Revisited (2007–2024), another portfolio experiment comparing broad-market and sector-fund strategies.
Jason Zweig’s article on differences between supposedly twin ETFs is really informative. I expect to do several more extensions along the lines of my recent Substack post, looking at whether differences in ETF choice matter in other sectors including electric utilities, emerging markets, semiconductors and when the sleeve of the portfolio Is highly diversified.
https://www.wsj.com/finance/investing/how-a-few-hot-stocks-can-make-twin-funds-act-like-strangers-0ef7c52b